Monitor Your Company's Stock Price on Grafana
Over the weekend, I built a way to monitor your company’s stock price on Grafana. That way you can roll back your release if the market thinks your code sucks. Simply create a “Text” visualization and paste the following HTML:
<img src="https://stonks.jse.li?symbol=GOOG&from=${__from}&to=${__to}" style="width:100%; height: 100%;" />
As you might have noticed, it’s not a normal Grafana visualization. It’s an SVG image rendered on the fly by a service I wrote. The source code can be found here:
https://github.com/veggiedefender/stock-svg
That’s horrible. Why would you build it like that?
The correct way to do this would have been to implement a new Grafana data source either from scratch or with Infinity. Unfortunately, creating and editing data sources requires admin permissions, and I’m not a Grafana admin at my company. Most employees of publicly traded companies aren’t.
This was discouraging. Red tape was getting in the way of shareholder value. As a shareholder and employee, that’s my value. I’m a neoliberal subject—an entrepreneur of the self, as Foucault put it—who has internalized the governing rationality of the market. To me, it’s a given that every need and desire can be financialized, and that the texture of my life is comparable to the fine bumps on a stock chart. And I’m not a Grafana admin. How am I to witness my self?
In the bargaining stage of my grief, I realized you can add HTML to Grafana “Text” visualizations, which means you can have an <img> tag that points to a dynamically generated image. There’s a way to build this, it’s just terrible. But so is everything. Grief cancelled, let’s get to work 🔥
Fetching stock data
Most stock price APIs cost money. There’s an undocumented Yahoo Finance API that works for free. Make a request to a URL that looks like this and you’ll get back some JSON with price data:
https://query1.finance.yahoo.com/v8/finance/chart/GOOG?period1=1751031000&period2=1751054400&interval=1m
If you curl it or request it from a script, you’ll probably get a response that says “Edge: Too Many Requests.” Just change your User-Agent header :3
The rest of this blog post is an SVG tutorial
If you’re new to Scalable Vector Graphics (SVG), it’s an XML-based markup language for vector images. The coordinate system puts (0, 0) at the top left corner, and positive coordinates stretch down and to the right. You can draw a rectangle using <rect> and a line using <line> and a bunch of lines connected together using <polyline>. Similar to HTML, elements have attributes and you can style them with CSS.
<svg xmlns="http://www.w3.org/2000/svg">
  <style>
    rect {
      fill: coral;
    }

    polyline {
      stroke: cornflowerblue;
      stroke-width: 4;
    }
  </style>

  <rect x="0" y="0" width="50" height="30" />
  <line x1="20" y1="70" x2="90" y2="20" stroke="black" />
  <polyline points="60,60 80,100 100,60 120,100 140,60 160,100" fill="none" />
</svg>

Plotting the line
We can plot our stock prices on a 100x100 grid and draw them with a polyline. We need to take care to flip the Y coordinates (subtract them from 100) since 0 starts at the top instead of bottom.
<svg viewBox="0 0 100 100" preserveAspectRatio="none" xmlns="http://www.w3.org/2000/svg" version="1.1">
  <style>
    polyline {
      fill: none;
      stroke-opacity: 0.7;
      stroke-width: 2;
      stroke: #56a64b;
      vector-effect: non-scaling-stroke;
    }
  </style>
  <polyline points="0.00,52.32 0.26,52.10 0.51,57.46 ..." fill="none" />
</svg>

The SVG coordinate system is an infinite grid, but the viewBox lets us set the bounds of where the “camera” is looking. We want it to look at our 100x100 zone, so we set it to 0 0 100 100. We also set preserveAspectRatio to "none" so the image can stretch arbitrarily in either direction.
Then we apply vector-effect: non-scaling-stroke to the line so that its thickness looks the same regardless of how the image is stretched.
You can drag to resize the image above, and toggle the vector-effect to see its impact.
Adding a gradient background
We can add an attractive gradient to the area below our line using a <linearGradient> and <polygon>. The polygon has the same points as the line itself, plus a point that stretches down to the bottom right corner (100, 100) and a point on the bottom left corner (0, 100). It looks like コ and the last point is automatically connected to the first point to close the shape.
<svg viewBox="0 0 100 100" preserveAspectRatio="none" version="1.1" xmlns="http://www.w3.org/2000/svg">
  <!-- <style> omitted for brevity -->
  <defs>
    <linearGradient id="gradient" x1="0" y1="0" x2="0" y2="100%">
      <stop offset="0%" style="stop-color: #56a64b; stop-opacity: 0.5"/>
      <stop offset="100%" style="stop-color: #56a64b; stop-opacity: 0"/>
    </linearGradient>
  </defs>
  <polygon points="0.00,52.32 0.26,52.10 0.51,57.46 ... 100,100 0,100" fill="url(#gradient)" />
  <polyline points="0.00,52.32 0.26,52.10 0.51,57.46 ..." fill="none" />
</svg>

Note that the polygon comes before the polyline. SVG elements stack back to front, and we want the line to appear on top of the background.
Adding text
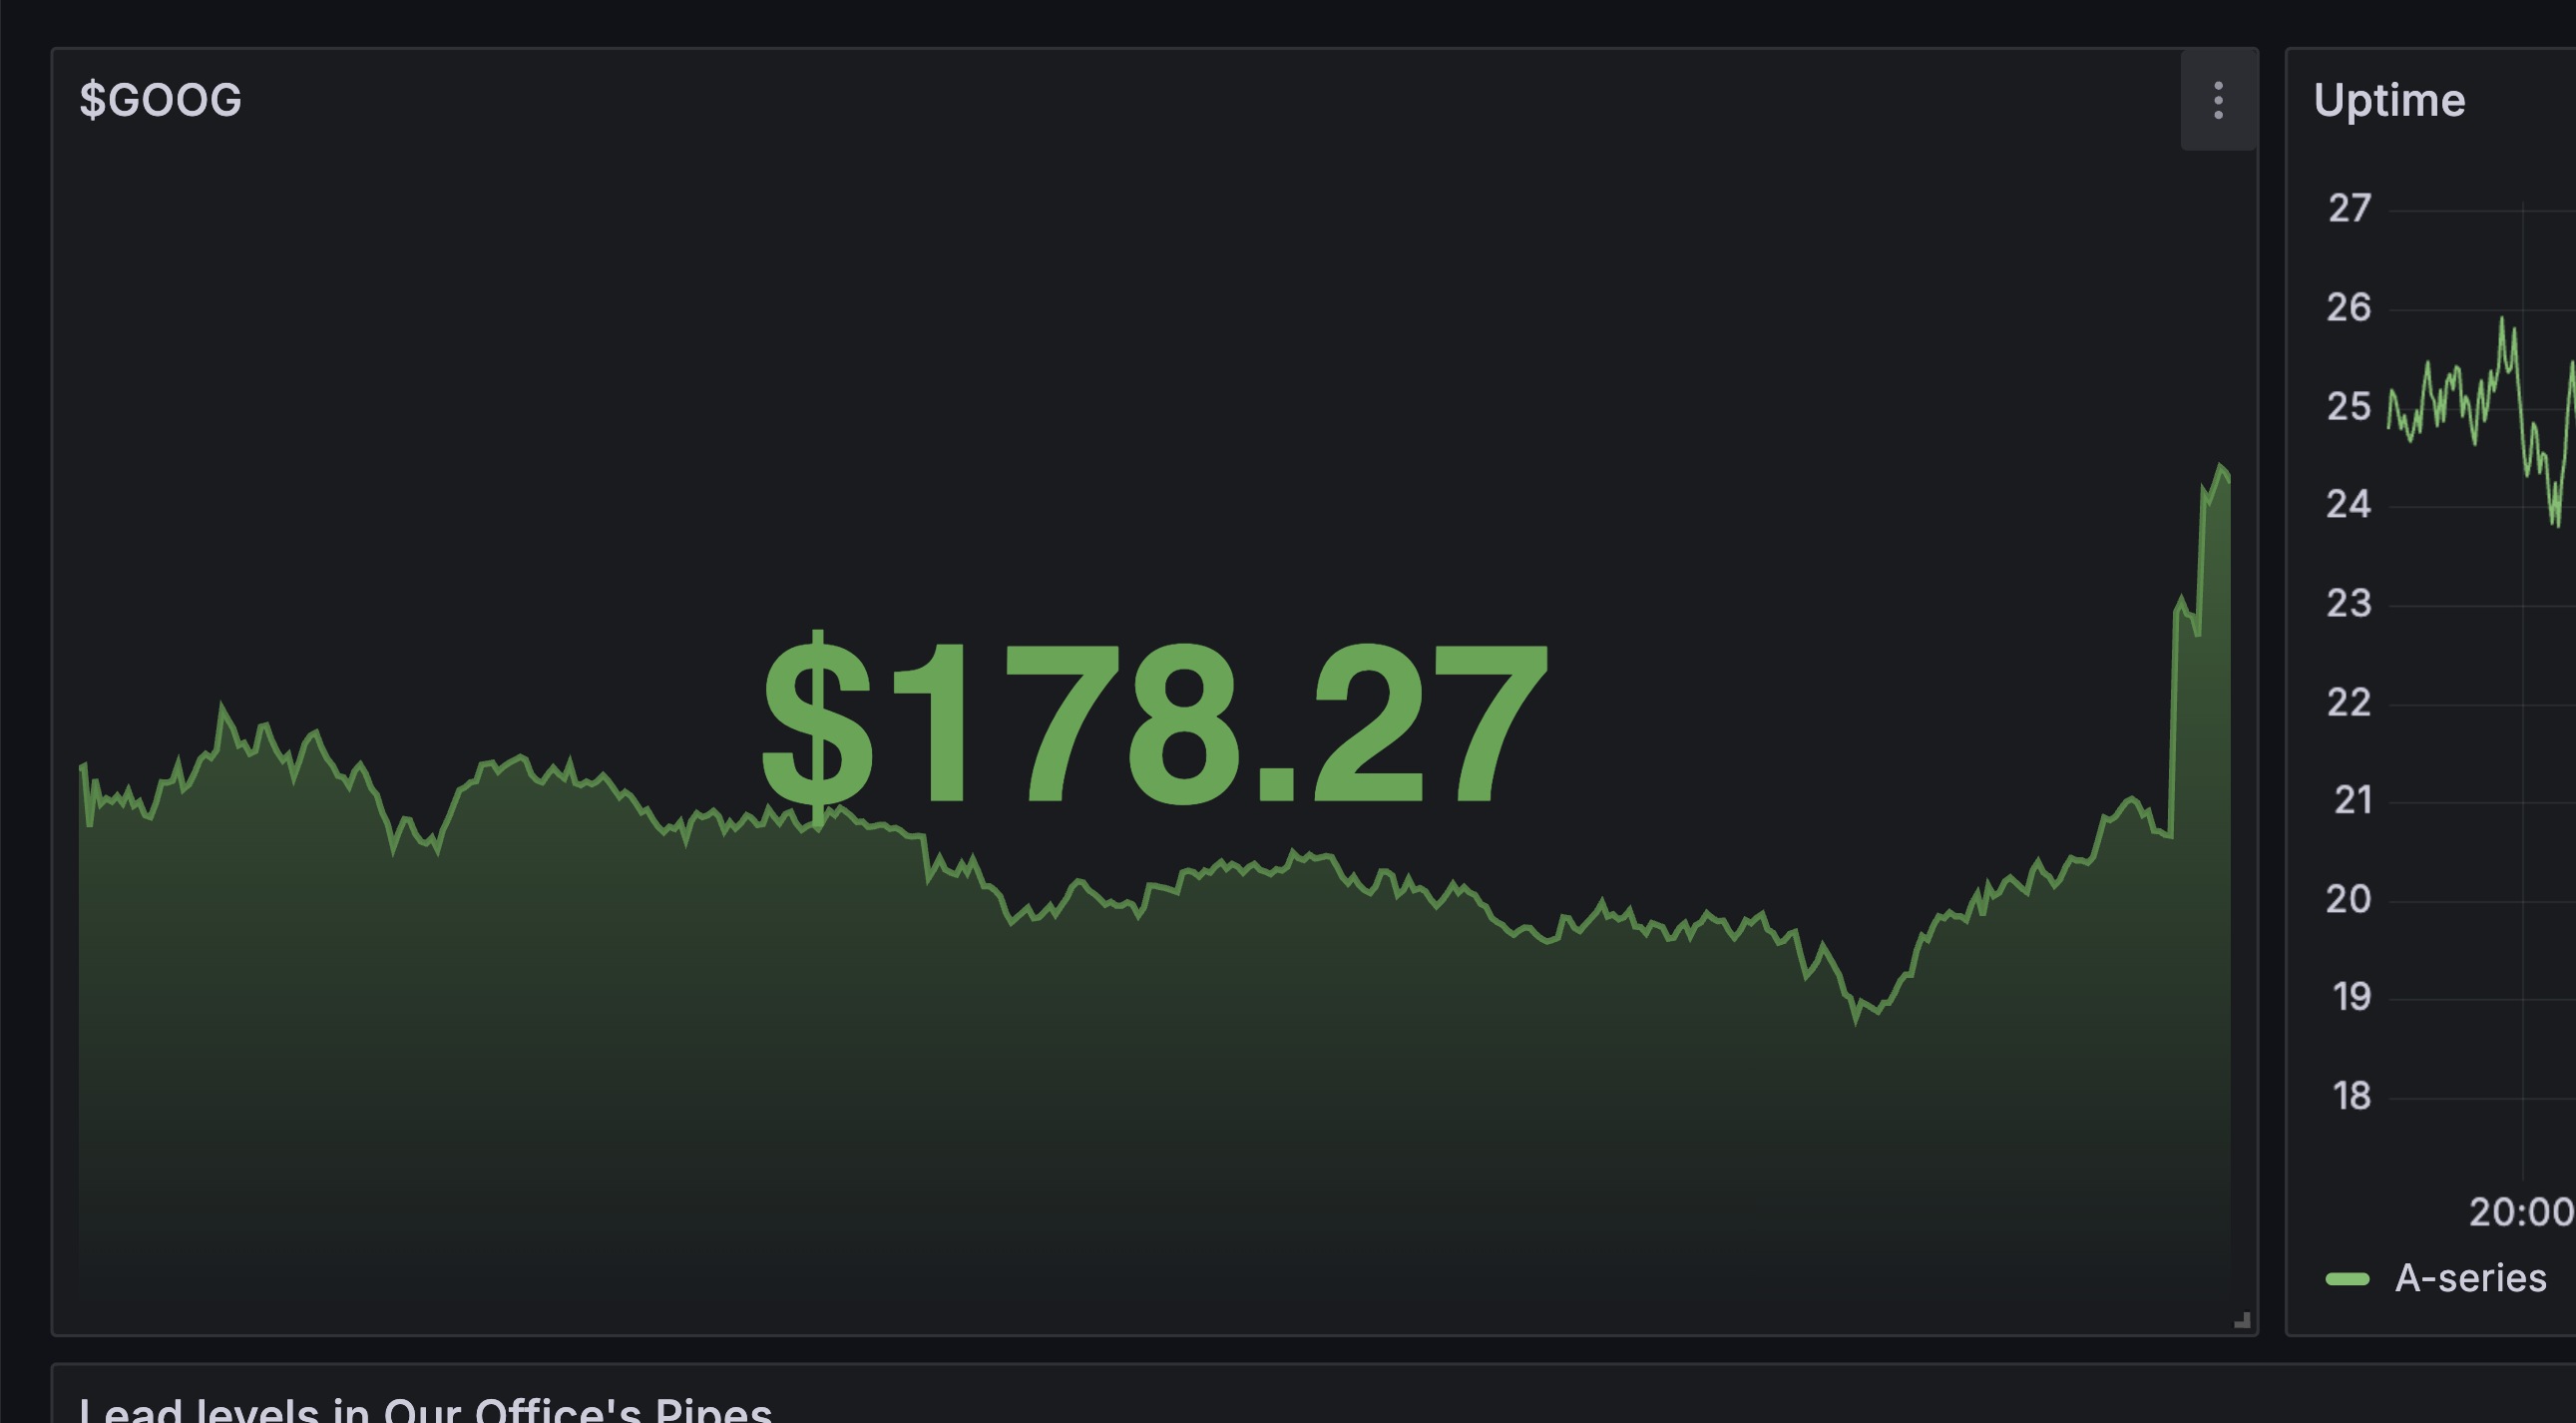
To mimic a Grafana “Stat” chart, we want to display the current stock price in the middle of the image using a <text> element.
<svg viewBox="0 0 100 100" preserveAspectRatio="none" version="1.1" xmlns="http://www.w3.org/2000/svg">
  <style>
    /* polyline styles omitted for brevity */

    text {
      fill: #56a64b;
      font-family: Inter, Helvetica, Arial, sans-serif;
      font-weight: bold;
    }
  </style>
  <!-- <defs> omitted for brevity -->
  <!-- <polygon> omitted for brevity -->
  <!-- <polyline> omitted for brevity -->
  <text x="50%" y="50%" text-anchor="middle" alignment-baseline="middle">$178.27</text>
</svg>

I shrunk the height on this one to make the effect more obvious on mobile. The text is getting stretched and it looks awful!
The stretching was desirable for the graph, but we want to somehow exempt the text. We can do this by nesting <svg> tags, and moving the viewBox and preserveAspectRatio attributes to the inner svg (containing the line and gradient). Then we can place the text in the outer svg where it will be unaffected by the stretching behavior.
<svg version="1.1" xmlns="http://www.w3.org/2000/svg">
  <style>
    /* styles omitted for brevity */
  </style>
  <svg viewBox="0 0 100 100" preserveAspectRatio="none">
    <defs>
      <linearGradient id="gradient" x1="0" y1="0" x2="0" y2="100%">
        <stop offset="0%" style="stop-color: #56a64b; stop-opacity: 0.5"/>
        <stop offset="100%" style="stop-color: #56a64b; stop-opacity: 0"/>
      </linearGradient>
    </defs>
    <polygon points="0.00,52.32 0.26,52.10 0.51,57.46 ... 100,100 0,100" fill="url(#gradient)" />
    <polyline points="0.00,52.32 0.26,52.10 0.51,57.46..." fill="none" />
  </svg>
  <text x="50%" y="50%" text-anchor="middle" alignment-baseline="middle">$178.27</text>
</svg>

Clipping
Let’s admire our work by zooming out and looking at data for a whole week:

Hmm! Those straight lines connecting each day look odd. Recall that the stock market opens every morning at 9:30 AM Eastern Time, and closes at 4:00 PM. Between closing time and the opening the next day, we have no price data.
We can define a clipping region with clipPath to display only the parts of the graph that actually have data.
<svg version="1.1" xmlns="http://www.w3.org/2000/svg">
  <style>
    /* styles omitted for brevity */
  </style>
  <svg viewBox="0 0 100 100" preserveAspectRatio="none">
    <clipPath id="trading-periods">
      <rect x="0.00" y="0" width="6.34" height="100" />
      <rect x="23.41" y="0" width="6.34" height="100" />
      <rect x="46.83" y="0" width="6.34" height="100" />
      <rect x="70.24" y="0" width="6.34" height="100" />
      <rect x="93.66" y="0" width="6.34" height="100" />
    </clipPath>
    <!-- <defs> omitted for brevity -->
    <polygon points="..." fill="url(#gradient)" clip-path="url(#trading-periods)" />
    <polyline points="..." fill="none" clip-path="url(#trading-periods)" />
  </svg>
  <text x="50%" y="50%" text-anchor="middle" alignment-baseline="middle">$178.27</text>
</svg>

Each rect inside the <clipPath> represents a day of trading. When we set the clip-path on our polygon and polyline, we’re telling the browser to only render the parts of them that overlap with the rectangles.
Making this into a web service
I wrote some code to generate the SVG and hosted it on Cloudflare Workers, a serverless platform that lets you run JavaScript on Cloudflare’s global infrastructure (disclosure: I work at Cloudflare). The code is pretty straightforward, and if you have a mental image of how it works after reading all this, you’re probably correct. The hardest part is the arithmetic. Here’s the repo:
https://github.com/veggiedefender/stock-svg
I want you to make something with SVG too!
I had a lot of fun learning about SVG and how to generate it without a framework. I hope reading about my process convinced you that it’s approachable if you have basic web dev skills, and it’s a great trick for sneaking dynamic behavior into anything foolish enough to trust you with an <img> tag. There is always a way to make something sillier.
MDN offers a great tutorial Introducing SVG from scratch if you want to learn more about it. But it’s more fun to just dive in and attempt a project. If you end up building something, please get in touch and show me!